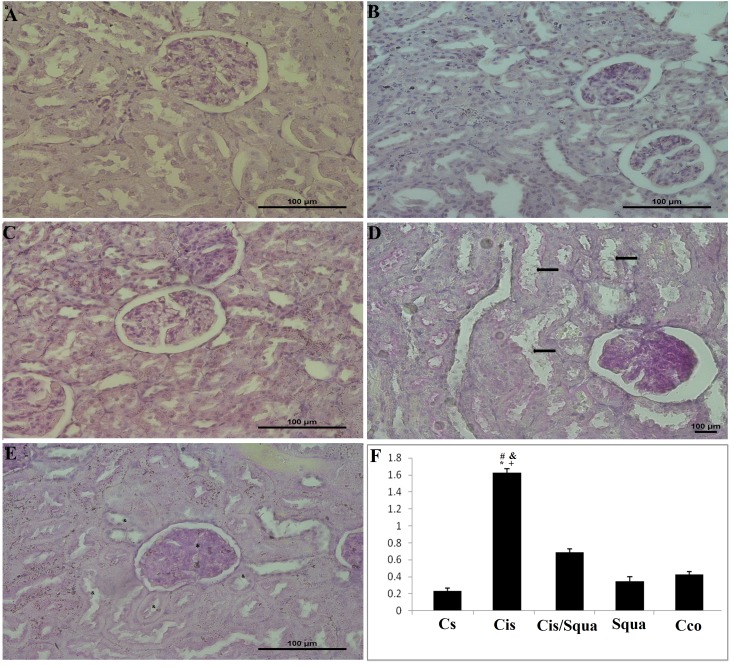
Figure 5.
PAS staining was applied for identifying the effects of cisplatin exposure on the expansion of mezengial matrix scoring in kidney tissues of the rats. Matrix expansion (shown with *) and proximal and distal tubul damages (shown with à) were detectable in cisplatin groups (d). Treatment with squalene groups (e) resulted in almost normal tubules (shown with &) and matrix expansion (shown with *) less than cisplatin group. In control (Cs) group (a), corn oil (Cco) (b), and squalene group (c) histological structure were normal. Magnification, a–e: 40×. (f) Mesangial matrix expansion % tissue in the kidney glomeruli. (*) indicates the comparison with the Cs (control receiving saline) group, (#) indicates the comparison with the cisplatin group, (&) indicates the comparison with the squalene group, and (+) indicates the comparison with the Cco (control receiving corn oil) group, all data were normalized against β-actin. For statistical significance, P ≤ 0.05.

