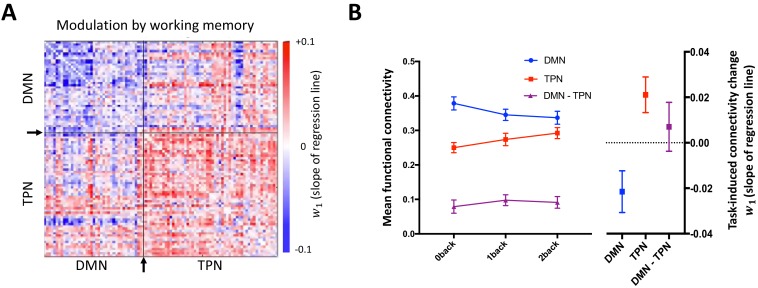
Figure 3. Task-induced changes in DMN and TPN functional connectivity.
Increasing working memory load is accompanied by decreasing functional connectivity within the DMN (negative values) and increasing functional connectivity within the TPN (positive values). (A) Mean task-induced functional connectivity change of each network edge (node-node connection) in the whole sample. Each edge (cell of the matrix) represents the regression coefficient ( value) of connectivity change as a function of working memory load, averaged over the whole group. Arrows and black lines indicate the boundary separating nodes allocated to the empirical DMN vs TPN. (B) Mean task-induced functional connectivity change within the DMN, TPN and DMN-TPN across the whole group. Left: Group mean (± S.E.M) functional connectivity strength (Fisher z-transformed r-value) within the DMN, TPN and DMN-TPN as a function of working memory load. Right: Group mean (± S.E.M) task-induced functional connectivity change within the DMN, TPN and DMN-TPN. was significantly different to zero in both the DMN (t50 = -2.33, P = 0.02, one-sample t-test) and TPN (t50 = 2.70, P = 0.01, one-sample t-test), but not the DMN-TPN (t50 = 0.65, P = 0.52, one-sample t-test). Repeated measures ANOVA indicated that was not equal within the DMN, TPN and DMN-TPN edges (F2,100 = 11.16 P < 0.001), and post-hoc paired t-tests confirmed that the of the DMN was significantly lower than both the TPN and DMN-TPN (t50 = -4.56, P < 0.001 and t50 = -3.01, P = 0.004, respectively), but that there was no significant difference between the of the TPN and DMN-TPN (t50 = 1.62, P = 0.11).

