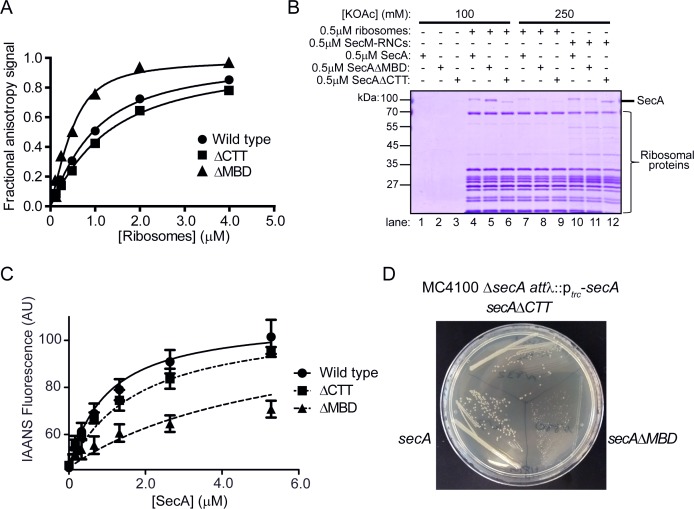
Figure 2. Effect of C-terminal truncations on SecA function in vitro and in vivo.
(A) 900 nM Ru(bpy)2(dcbpy)-labelled SecA (Wild type; circles), SecAΔMBD (ΔMBD; triangles) or SecAΔCTT (ΔCTT; squares) was incubated in the presence of increasing concentrations of purified 70S ribosomes. Because error bars corresponding to one standard deviation obscured the symbols, they were omitted from the graph. The equilibrium dissociation constant (KD) of the complex was determined by fitting the increase in fluorescence anisotropy from the Ru(bpy)2(dcbpy) (lines; Table 1). (B) 0.5 μM SecA, SecAΔMBD or SecAΔCTT was incubated in the absence (lanes 1–3) of ribosomes, in the presence of 0.5 μM vacant 70S ribosomes (lanes 4–9) or in the presence of 0.5 μM RNCs containing nascent SecM peptide (lanes 10–12). Where indicated, binding reactions were incubated in the presence of 100 mM (lanes 1–6) or 250 mM (lanes 7–12) potassium acetate (KOAc). Binding reactions were layered on a 30% sucrose cushion and ribosomes were sedimented through the sucrose cushion by ultracentrifugation. Ribosomal pellets were resolved by SDS-PAGE and stained by Coomassie. (C) 600 nM IAANS-VipB peptide was incubated with increasing concentrations of SecA (Wild type; circles), SecAΔMBD (ΔMBD; triangles) or SecAΔCTT (ΔCTT; squares). Confidence intervals represent one standard deviation. The KD for the SecA-peptide complex was determined by fitting the increase in IAANS fluorescence upon binding to SecA (lines; Table 1). (D) Growth of strains producing SecA (DRH1119; bottom left), SecAΔMBD (DRH1120; bottom right) and SecAΔCTT (DRH1121; top) on LB plates containing 100 μM IPTG.
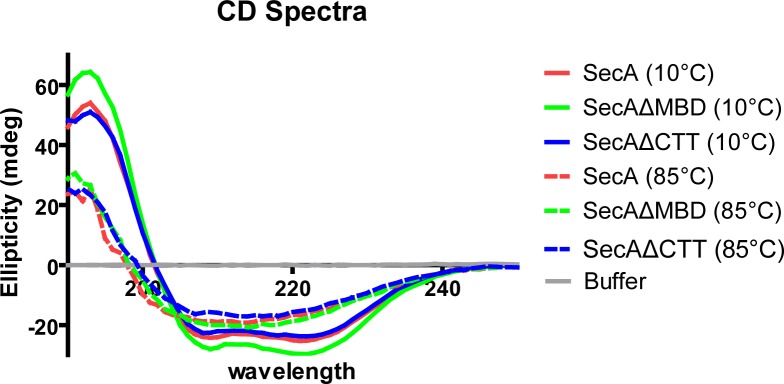
Figure 2—figure supplement 1. CD spectra of SecA, SecAΔMBD and SecAΔCTT.
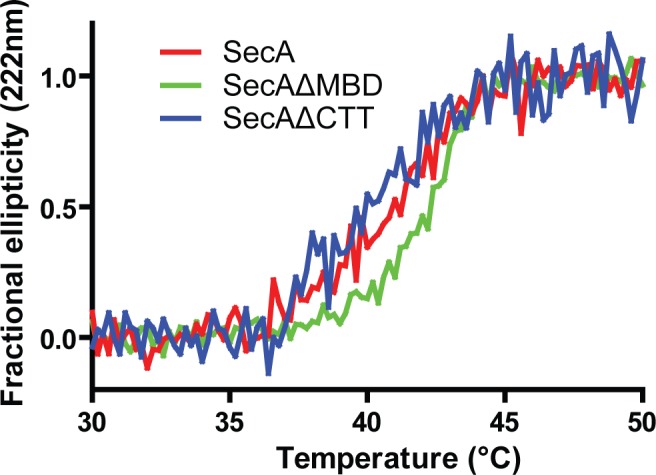
Figure 2—figure supplement 2. Thermal denaturation plots of SecA, SecAΔMBD and SecAΔCTT.

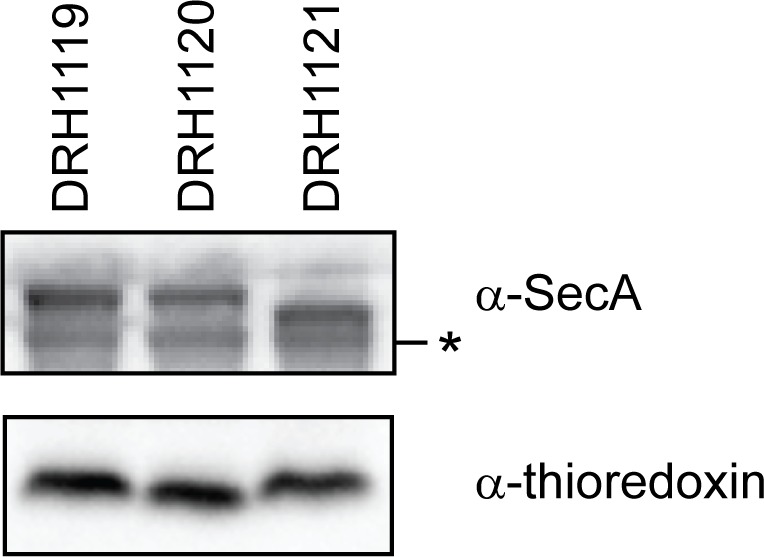
Figure 2—figure supplement 3. Expression of SecA, SecAΔMBD and SecAΔCTT in strains DRH1119, DRH1120 and DRH1121.


