. 2019 Jul 10;8:e42271. doi: 10.7554/eLife.42271

Figure 3. Conformational change within mIg heavy chain is dependent on the cytoplasmic tail.

(A) Schematic illustration of different types of VRC01-BCR equipped with different cytoplasmic tail. FRET efficiency between CoA 488 label at N-terminus (red circle) and ReAsH at Cμ2 domain (or Cγ2 portion, brown circle) of dually tagged VRC01-BCR was examined. (B) Dequenching FRET to measure the FRET efficiency between CoA 488 and ReAsH in 293T cells expressing dually tagged VRC01-BCR activated by V51 monomer antigen. From left to right: IgM, MMG, IgG, GGM. Error bars represent mean ± SEM. Data are from at least 19 cells over two independent experiments. Two-tailed t-tests were used for the statistical comparisons. ***p<0.001.

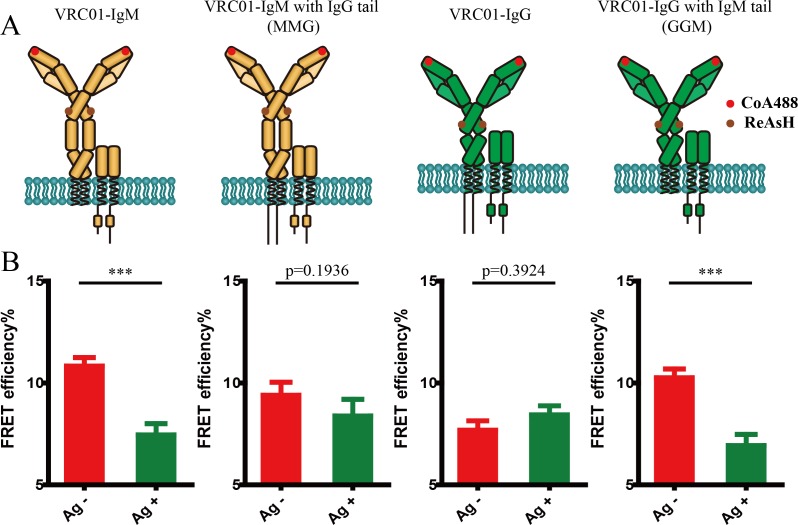
Figure 3.

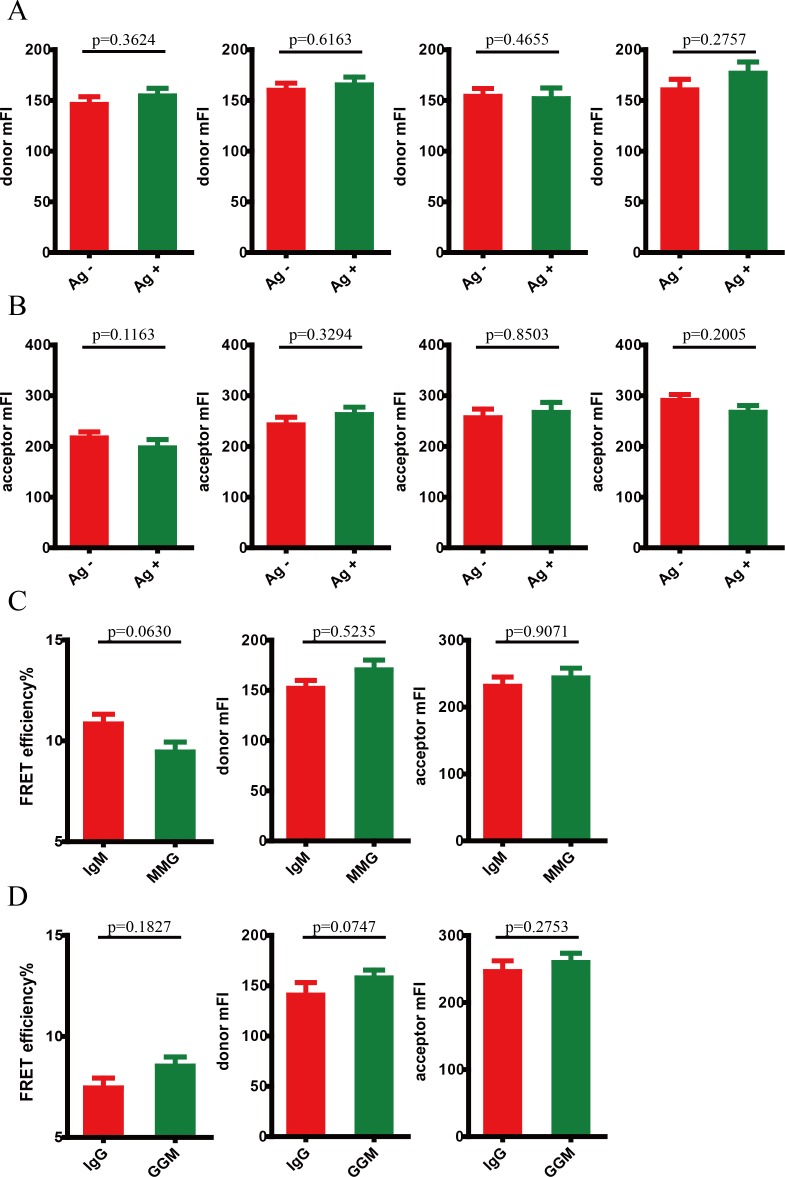
Figure 3—figure supplement 1. Conformational change within mIg heavy chain is dependent on the cytoplasmic tail.

Figure 3—figure supplement 1.

(A–B) Cells with equal donor intensity (A) and equal acceptor intensity (B) were used for FRET analysis. From left to right: IgM, MMG, IgG, GGM. (C–D) Dequenching FRET to measure the FRET efficiency between CoA 488 and ReAsH in 293T cells expressing dually tagged VRC01-BCR in the absence of antigen. (C) Comparison between IgM and MMG; (D) comparison between IgG and GGM. Error bars represent mean ± SEM. Two-tailed t-tests were used for the statistical comparisons.
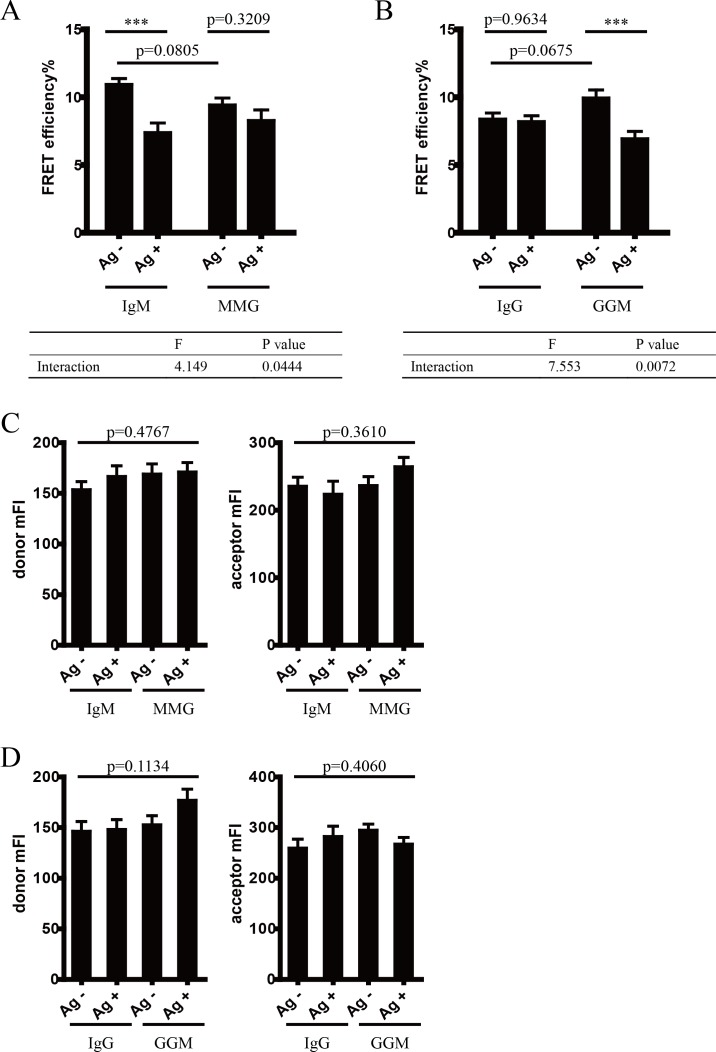
Figure 3—figure supplement 2. Conformational change within mIg heavy chain is dependent on the cytoplasmic tail.

Figure 3—figure supplement 2.

(A–B) Two-way ANOVA was used for analysis of the interaction effect between Ig cytoplasmic tail and antigen engagement. Two-way ANOVA with Sidak’s correction for multiple comparisons was used for statistical comparison between each group. (A) Comparison between IgM and MMG; (B) comparison between IgG and GGM. (C–D) Cells with comparable fluorescent intensity of donor and acceptor were used for analysis. One-way ANOVA was applied. (C) Comparison between IgM and MMG; (D) comparison between IgG and GGM. ***p<0.001.