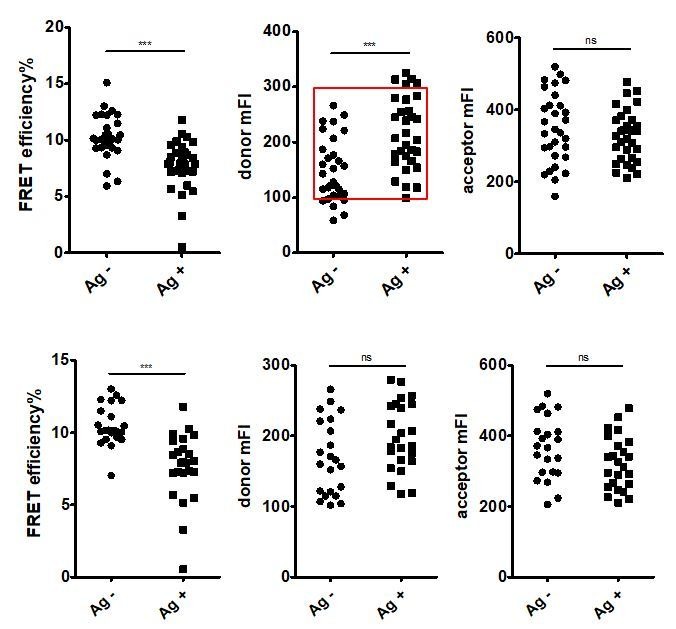
Author response image 9. FRET efficiency, mean fluorescent intensity of donor and mean fluorescent intensity of acceptor before matching the fluorescent intensity of control group and antigen group were shown.

Since the fluorescent intensity of donor in control group was significantly lower, a subset of cells with comparable donor fluorescent intensity were selected as shown in red square for further analysis (top). FRET efficiency, mean fluorescent intensity of donor and mean fluorescent intensity of acceptor after matching the fluorescent intensity of control group and antigen group were shown (bottom).
