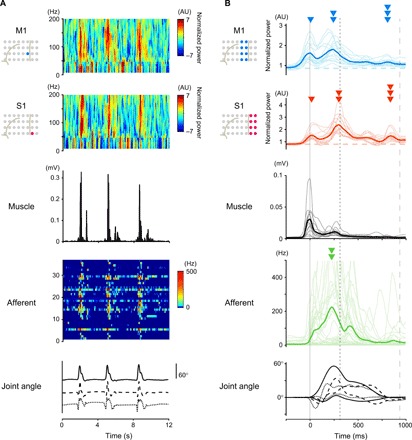
Fig. 1. Simultaneous recording of cortical and peripheral activities showed movement-related modulation of these activities.

(A) An example of simultaneous recording of three trials by Monkey T. Top row and second row: Power spectrograms of the respective electrodes in M1 and S1. Third row: EMG signal from the shoulder muscle. Fourth row: The instantaneous firing rate of an ensemble of peripheral afferents. Bottom row: Three forelimb joint angles along the extension-flexion axis (shoulder, solid line; elbow, dashed line; wrist, dotted line). (B) Modulations of cortical and peripheral activity in Monkey T aligned to movement onset. Top and second: Modulations of high-γ activity in M1 and S1. Third: EMG signals of 12 forelimb muscles. Fourth: Instantaneous firing rate of a neural ensemble of peripheral afferents. Bottom: Six forelimb joint angles (shoulder, solid lines; elbow, dashed lines; wrist, dotted lines). Thin lines represent the activity in each electrode (M1 and S1), units (afferent), and muscles, and thick lines represent their respective averages. The vertical solid, dotted, and dashed lines represent times of the onset of movement, pulling the lever, and the end of the movement, respectively. Arrowheads represent the peak times of respective activities. AU, arbitrary units.
