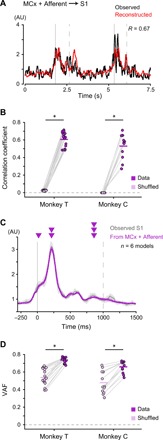
Fig. 2. Combined activities in MCx and afferents account for S1 activity.

(A) Reconstruction of S1 activity using combined activities in MCx and peripheral afferents of Monkey T. Examples of two successive movements. Black line, the observed activity in S1; red line, the reconstructed activity; R, correlation coefficient between the observed and reconstructed activities; vertical solid lines, movement onset; vertical dashed lines, end of movement. (B) Mean decoding accuracy pooled across ECoG electrodes in S1. The correlation coefficient between the observed and reconstructed traces from the recorded data compared with the correlation coefficient between the observed traces and the traces reconstructed from random shuffling of activity (Monkey T: mean, n = 16 signals; Monkey C: mean, n = 12 signals; *P < 0.001). Superimposed bars, mean. (C) Average modulation of the observed S1 activity in Monkey T (S1, gray) and the reconstruction using combined activities in MCx and peripheral afferents (MCx + Afferent, purple) aligned to movement onset. Vertical solid lines, movement onset; vertical dashed lines, average time of end of movement; solid lines, means; shading, SD. (D) Variance accounted for (VAF) between the observed and reconstructed traces throughout the duration of S1 modulation (−100 to 1400 ms around movement onset for Monkey T, −100 to 1500 ms for Monkey C).
