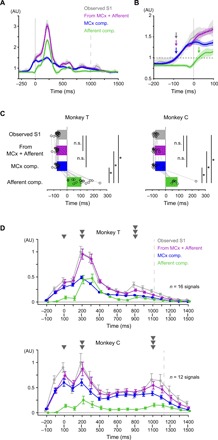
Fig. 3. MCx and afferent activities account for S1 activity in temporally different ways.

(A) Average modulation of the observed S1 activity in Monkey T (S1; gray), the reconstruction using combined activities in MCx and peripheral afferents (MCx + Afferent; purple), and each component in the reconstruction (MCx component, blue; Afferent component, green) aligned to movement onset (from the same session in Fig. 2C). Vertical solid line, movement onset; vertical dashed line, average time of end of movement; solid lines, mean; shading, SD. (B) Magnification of (A). Horizontal dashed line, threshold for the onset of activity; arrows, onset times. (C) Onset times of the observed S1 activity (gray), of the reconstruction using combined activities in MCx and peripheral afferents (purple), and of each component (MCx component, blue; Afferent component, green) (Monkey T: mean, n = 16 signals; Monkey C: mean, n = 12 signals: *P < 0.01). n.s., not significant. Superimposed bars, mean. (D) The areas above the baseline of the observed S1 activity (S1, gray), the reconstruction using combined activities of MCx and peripheral afferents (MCx + Afferent, purple), and each component (MCx component, blue; Afferent component, green) in 100-ms sliding time windows. Dashed line, average time of end of movement; error bar, SE.
