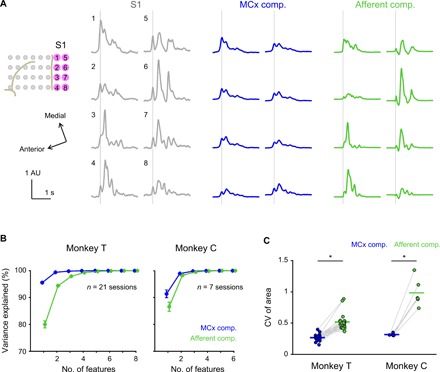
Fig. 4. MCx and afferent activities account for S1 activity in spatially different ways.

(A) Average modulation of the observed activity in S1 electrodes of Monkey T (gray) and respective MCx (blue) and Afferent (green) components aligned to movement onset. Vertical lines, movement onset; solid lines, mean. (B) Principal component analysis (PCA) of the MCx and Afferent components in all S1 electrodes. Cumulative variance explained by the PCA components plotted against the number of feature dimensions used. Error bars, SE. (C) Coefficient of variation (CV) of areas above the baseline of the MCx and Afferent components in all S1 electrodes throughout the duration of S1 modulation (Monkey T: n = 21 sessions; Monkey C: n = 6 sessions; *P < 0.05). A pair including an outlier (CV of the Afferent component, 5.56; CV of the MCx component, 0.37 in Monkey C) is not used in the analysis. Superimposed bars, mean.
