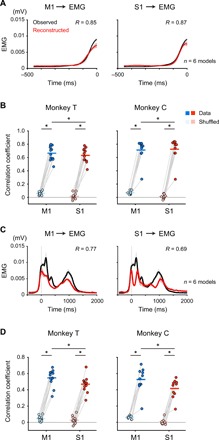
Fig. 5. Premovement activities in M1 and S1 encode muscle activity.

(A) Reconstruction of EMG profile (aligned to movement onset) of a hand muscle during the premovement period (−500 to 0 ms around movement onset) in Monkey C using the activity in M1 or S1 before movement onset (time = 0). Black and red traces show the observed and reconstructed EMG using the activity in M1 (left) or S1 (right), respectively. R, correlation coefficient between the observed and reconstructed EMG; solid lines, mean; shading, SD. (B) Mean decoding accuracy pooled across muscles (Monkey T: n = 12 muscles; Monkey C: n = 10 muscles). Plotted are correlation coefficients between the observed and reconstructed traces from the data (M1, cyan; S1, red) compared with those between the observed traces and the traces reconstructed from random shuffling of activity (Monkey T: n = 12 muscles; Monkey C: n = 10 muscles; *P < 0.01). Superimposed bars, mean. (C) Reconstruction of EMG profile throughout the premovement and movement periods (−500 to 2000 ms around movement onset). The diagrams use a similar format for (A). (D) Mean decoding accuracy of the reconstruction throughout the premovement and movement periods. The diagrams use a similar format for (B).
