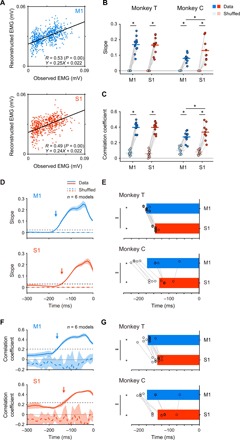
Fig. 6. Premovement activity in S1 encodes the initial burst of muscle activity slightly after M1 does.

(A) Scatterplots of observed peak EMG amplitude of the hand muscle versus reconstructed EMG amplitude using the premovement activity in M1 (cyan) or S1 (red) of Monkey T. Dot, a single trial. Equation of the fitting is shown in the lower right corner. R, correlation coefficient between the observed and reconstructed EMG. (B and C) Average slopes of regression lines (B) and correlation coefficients (C) pooled across muscles (Monkey T: n = 12 muscles; Monkey C: n = 10 muscles; *P < 0.05). Superimposed bars, mean. (D and F) Average slopes of regression lines (D) and correlation coefficients (F) were plotted against the end of 50-ms sliding windows. Solid lines, means; shading, SD; dashed black line, threshold for onset of activity; arrows, onset. (E and G) Onset times of M1 (cyan) and S1 (red) activities that encode peak EMG amplitude pooled across electrodes were less than the onset time of EMG (E, slopes; G, correlation coefficients; Monkey T: n = 12 muscles; Monkey C: n = 9 muscles; *P < 0.01). Onset time of the activity in M1 was earlier than that in S1 (Monkey T: n = 12 muscles; Monkey C: n = 9 muscles; **P < 0.01). Superimposed bar graphs, mean.
