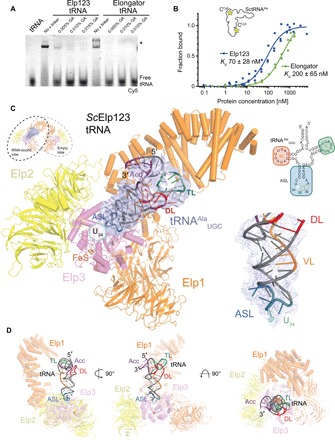
Fig. 2. Cryo-EM structure of Elp123 bound to tRNAAlaUGC.

(A) EMSA assay using endogenous Elp123 (left), recombinant Elongator (right), and fluorescently labeled tRNAAlaUGC in the presence of different concentrations of glutaraldehyde. The positions of free tRNA and protein-tRNA complexes (*) are indicated next to the native polyacrylamide gel electrophoresis (PAGE). (B) Representative microscale thermophoresis measurements, respective fits, and calculated dissociation constant (Kd) values for Elp123 (blue) and Elongator (green). In both cases, the Hill coefficient is close to 1, indicating the presence of independent binding sites. n = 3. (C) Atomic model of Elp123 lobe bound to tRNA (Elp1, orange; Elp2, yellow; Elp3, violet) showing additional electron density for tRNA at a resolution of 4.4 Å. The fitted tRNAAlaUGC model is colored in accordance to the scheme on the right [purple, acceptor stem (Acc); red, D-loop (DL); blue, ASL; orange, variable loop (VL); green, T-loop (TL)]. Close-up view highlighting the phosphate backbone of the VL and ASL following the density (bottom right). (D) Atomic model of Elp123-tRNA from different perspectives.
