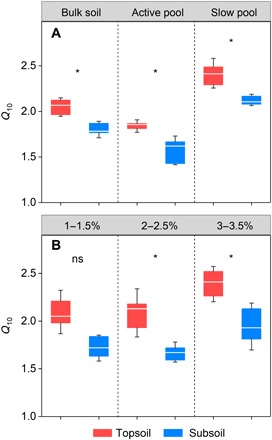
Fig. 1. Q10 values for various SOM components in the topsoil and subsoil.

(A) Q10 for bulk soil, active pool, and slow pool. (B) Q10 for three cumulative respired soil C fractions. The ends of the boxes represent the 25th and 75th percentiles. The horizontal lines inside each box and the whiskers show the median and the SD, respectively (n = 9). *P < 0.05, significant difference between the topsoil and the subsoil; ns, no significant difference.
