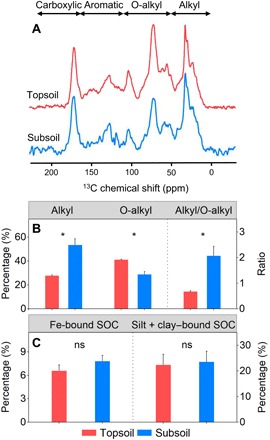
Fig. 2. Comparison of SOM composition and mineral protection between the topsoil and the subsoil.

(A) 13C CPMAS NMR spectra. Chemical shifts of 0 to 50, 50 to 110, 110 to 165, and 165 to 220 parts per million (ppm) represent alkyl C, O-alkyl C, aromatic C, and carboxylic C, respectively. (B) Percentage of alkyl C and O-alkyl C relative to total SOC and ratio of the two SOM compositions. (C) Percentage of Fe-bound SOC and silt + clay–bound SOC relative to total SOC. Error bars denote SE (n = 9). *P < 0.01, significant difference between the topsoil and the subsoil. ns, no significant difference.
