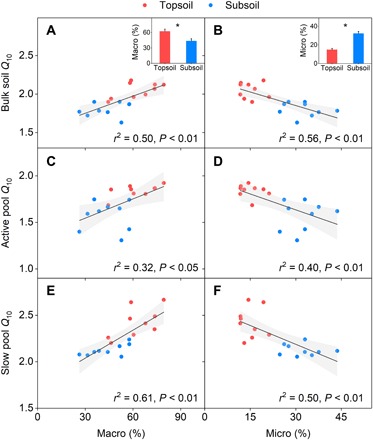
Fig. 3. Relationships between Q10 and C distribution in aggregates.

(A and B) Bulk soil Q10 with macro and micro. (C and D) Active pool Q10 with macro and micro. (E and F) Slow pool Q10 with macro and micro. Macro refers to the percentage of soil C stored in macroaggregates (250 to 2000 μm), and micro denotes the percentage in microaggregates (53 to 250 μm). Red circles represent samples in the topsoil (n = 9), and blue circles represent samples in the subsoil (n = 9). r2 is the proportion of variance explained. The insets show the depth-associated variations of C distribution in macroaggregates and microaggregates, respectively. Error bars denote SE (n = 9). *P < 0.01, significant difference between the two soil depths.
