
Fig. 3. Glucose- and structure-dependent insulin release.
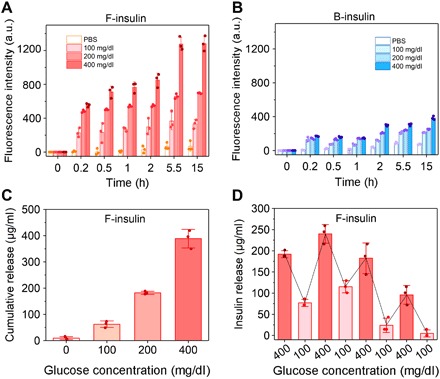
(A and B) Glucose-dependent insulin release from F-insulin (A) and B-insulin (B) over time. Insulin was labeled with rhodamine B. The glucose concentrations were set to 0, 100, 200, and 400 mg/dl. Data points are means ± SD (n = 3). a.u., arbitrary units. (C) Cumulative insulin release profile of F-insulin. The complex was incubated in each solution for 10 min. Data points are means ± SD (n = 3). (D) Pulsatile insulin release from F-insulin by alternating the glucose concentration. The complex was incubated in each solution for 2 min. Data points are means ± SD (n = 3).