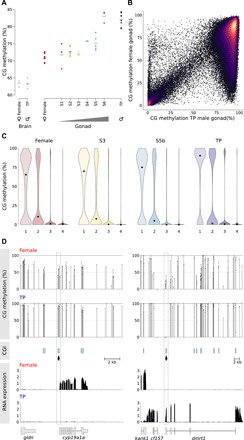
Fig. 6. Global methylation changes and relationship between methylation and gene expression during sex change.

(A) Global CG methylation levels during sex change examined by low-coverage sequencing. The horizontal bar indicates the mean. Gray dots, brain samples; colored dots, gonadal samples. (B) Comparison of methylation (2-kb running windows) between female and TP male gonadal methylomes. Only probes with >100 calls were included for the analysis. (C) Violin plot showing distribution of methylation at transcription start sites (TSS) of genes classified into quartiles according to expression level (highest, 4). Each violin is scaled to the same maximum width (total area is not constant between violins) to demonstrate distributions for each quartile. Black dots denote the median. (D) Relationship between CpG methylation and RNA expression for cyp19a1a and dmrt1. CG methylation track shows methylation levels for dinucleotides with >10 calls; CGIs were predicted according to the Gardiner-Garden and Frommer criteria. Changes in TSS methylation containing CGIs (dashed box) are negatively correlated with gene expression for both genes (bottom).
