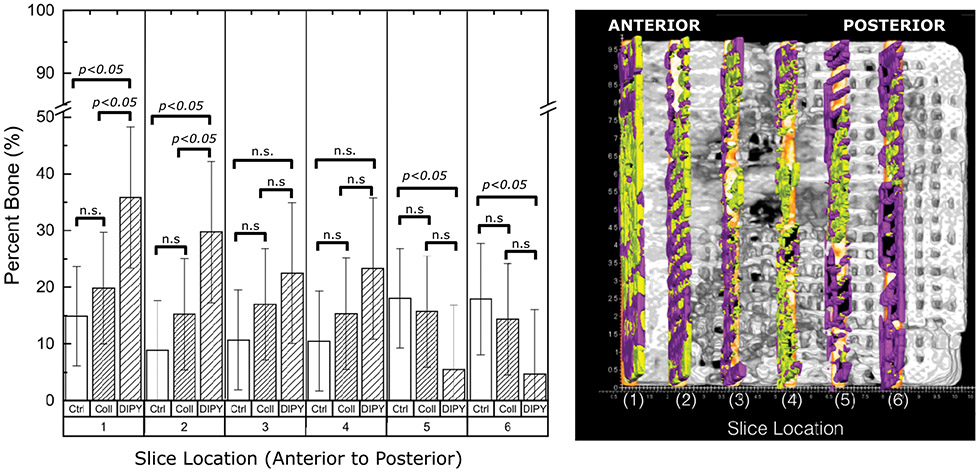
Figure 7:
Slice Analysis (a)Quantified bone regeneration within scaffold porosity from anterior (deepest aspect) to posterior (most exposed aspect) scaffold in 1.5 mm increments by experimental group. Slices were 0.25mm thick. Within each category (e.g. Ctrl, COLL, DIPY) different numbers of asterisks denote statistical differences that are significant (e.g. one asterisk is significantly different from two). All p<0.05. (b) AMIRA software depiction of slices selected for quantification. Bone is in yellow and scaffold is in purple.

