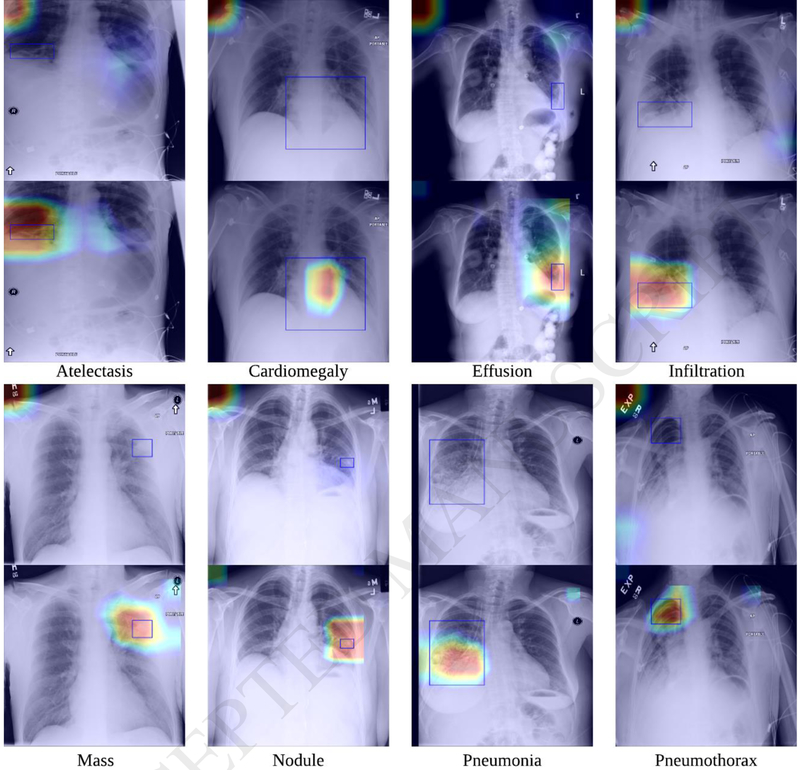
Fig. 9.
Examples illustrating the detected lesion regions using the traditional method (i.e., fine-tuned DenseNet-121 trained solely on the entire CXR images) (top) and our proposed SDFN (bottom). The red represents high activation and the blue represents low activation. The blue boxes are the lesion regions annotated by a board certified radiologist.

