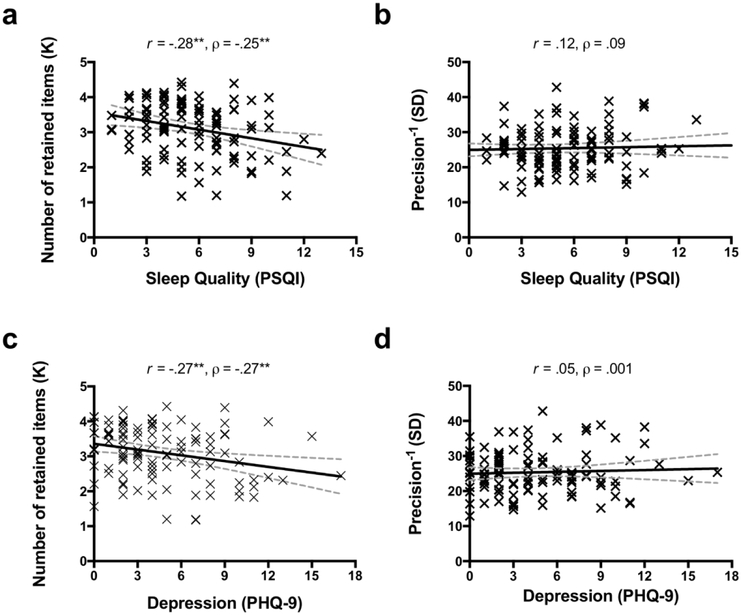
Figure 2.
The effects of depressed mood and sleep quality on WM capacity in Study 1. Sleep quality (score from the full scale of PSQI) was significantly correlated with WM capacity (a), but not with precision (b). Depressed mood (score from the full scale of PHQ-9) was significantly correlated with WM capacity (c), but not with precision (d). The solid lines represent the linear regression prediction. The broken lines represent 95% confidence intervals (CI) for the linear regression prediction. Pearson correlation coefficient (r) and Spearman rank-order correlation coefficient (ρ) are presented in the figure. *. p < .05, **. p < .01.

