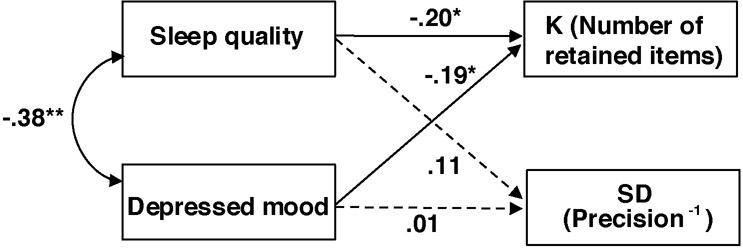
Figure 3.
Correlated predictive model of sleep quality, depressed mood, and WM. K denotes the number of retained WM representations, as an estimate of capacity; SD denotes variability of retained WM recall errors, which is inversely related to precision. The broken lines indicate insignificant relationships. Note, the scores from the non-overlapping versions of PSQI and PHQ-9 that removed conceptually overlapping items were used in this multiple regression analysis *. p < .05.

