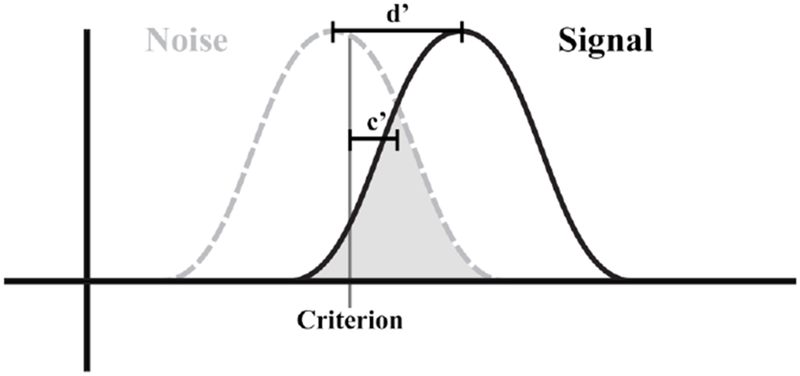
Fig. 2.

Visual representation of signal detection theory (SDT). Black distribution (signal) represents the probability density distribution of identifying a target word. Dashed gray distribution (noise) represents the probability density distribution of identifying a distractor word. d’ represents the distance between the signal and noise probability density distributions. Light gray represents the overlap between the two probability density distributions. Criterion is the cut-off point in which a participant decides a signal (target word) is present. c′ measures the distance of the criterion to the point midway between the two distributions.
