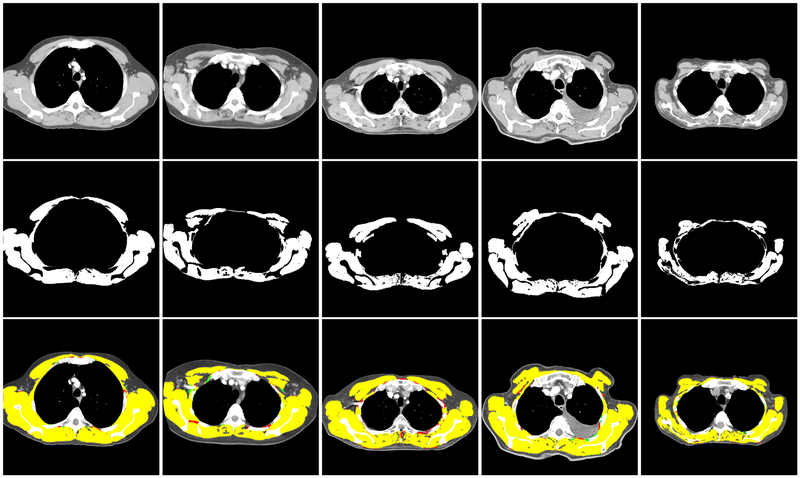
Figure 6:
Illustration of performance on the T4 dataset. Top row shows some T4 samples. In the middle row, their corresponding manual muscle segmentation are illustrated. Bottom row shows the overlaying result of the predicted map and ground truth. Yellow regions are the pixels that are correctly classified as muscle. Red pixels are the pixels that are mis-classified as muscle and green pixels are the muscle pixels which are missed from predicted map. Note that the predicted automatic segmentation performs well on a range of muscle profiles.

