
Fig. 3.
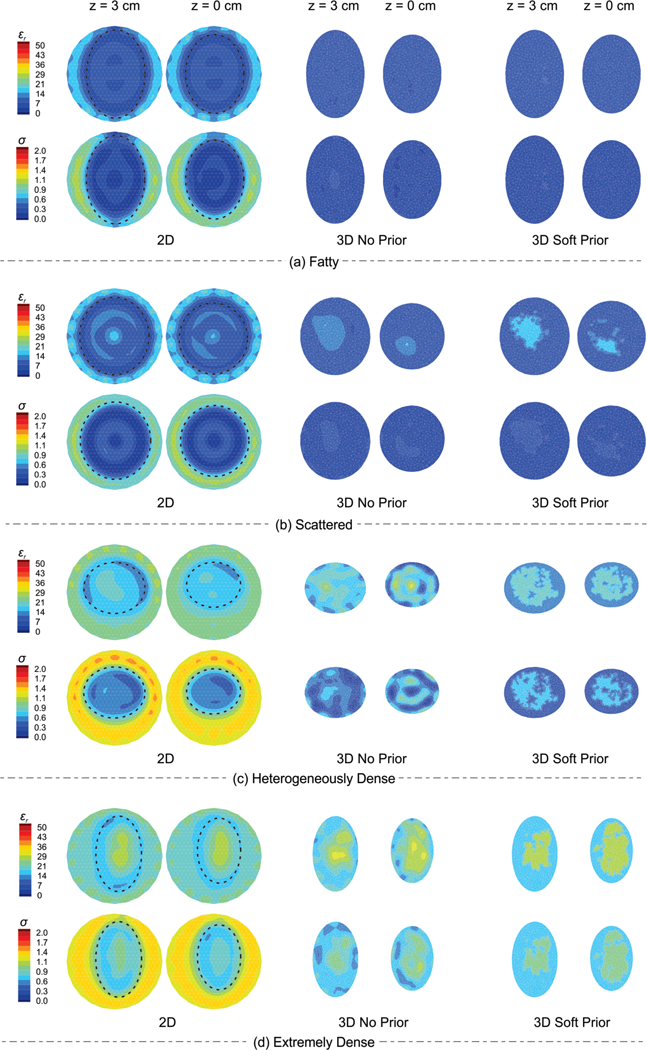
Representative permittivity (top row) and conductivity (bottom row) images from the 2D, 3D no prior, and 3D soft prior reconstructions for two representative planes (z = 3 and z = 0 cm) for (a) fatty, (b) scattered, (c) heterogeneously dense, and (d) extremely dense breasts numerical phantoms, respectively. Dashed-lines on the 2D images correspond to the outline of the breast.