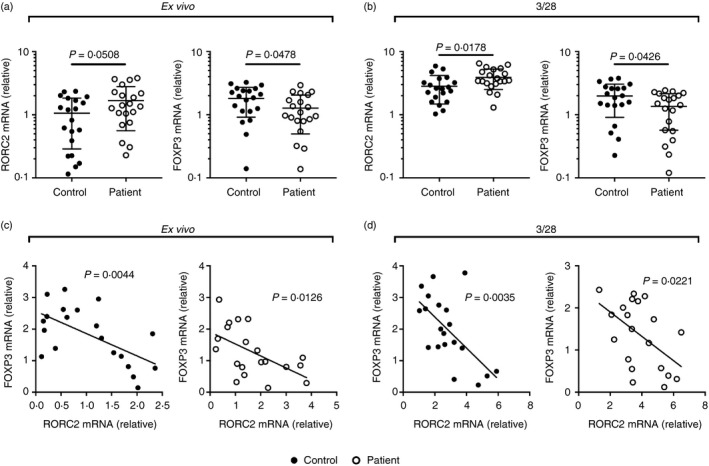
Figure 2.

Expression of RORC2 and FOXP3 in CD4+ T cells from patients with chronic obstructive pulmonary disease‐associated pulmonary hypertension (COPD‐PH) and controls. (a) The expression of RORC2 and FOXP3 in CD4+ T cells ex vivo. (b) The expression of RORC2 and FOXP3 in CD4+ T cells upon CD3/CD28 activation. Unpaired t‐test with Welch's correction. (c) The correlation between ex vivo RORC2 and FOXP3 expression. (d) The correlation between RORC2 and FOXP3 expression upon CD3/CD28 stimulation. Pearson correlation test.
