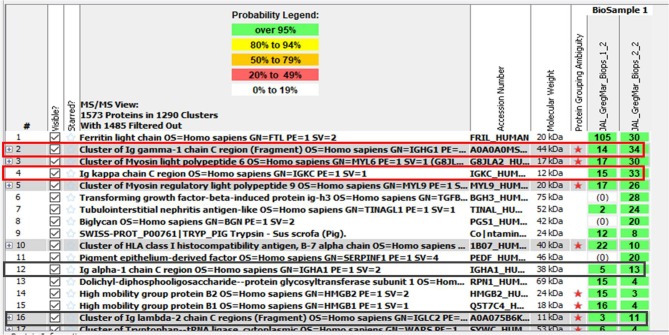
Fig. 3.
Mass spectrometric proteomic analysis listing the proteins identified in the spleen and kidney tissue. Biops 1–2 represent peptides detected in the spleen. Biops 2–2 represent peptides detected in then kidney. Fragments of IgG heavy chain constant region and fragments of kappa light chain constant region were detected in both tissues

