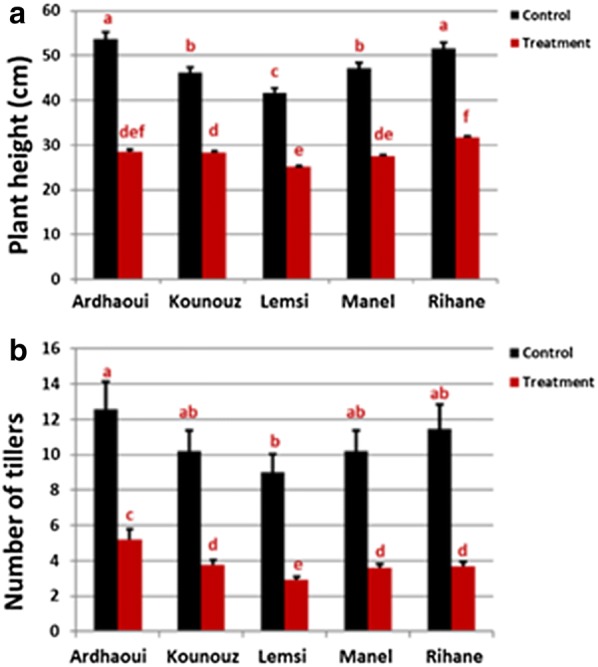
Fig. 2.

Plant height (a) and number of tillers (b) for the five barley genotypes under control and salinity treatment conditions. Significant differences among the genotypes, treatments and the interaction showed with the red letters and has been calculated using R 3.5.3 (P value < 0.05) (color figure online)
