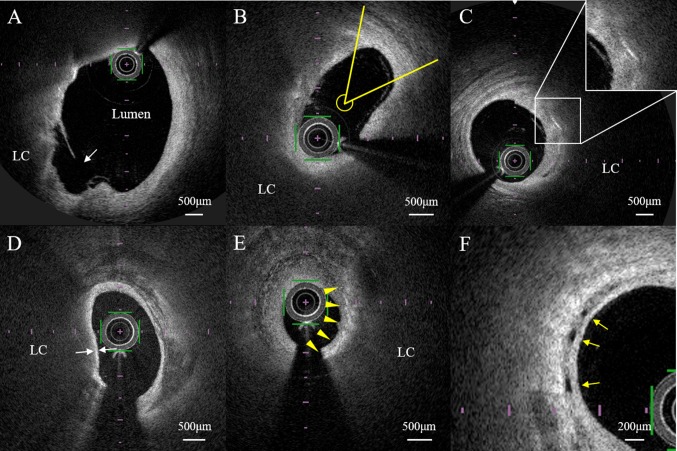
Fig. 1.
Representative plaque images from optical frequency domain imaging (OFDI). a Ruptured plaque (white arrow) with fibrous cap discontinuity leading to communication between the lipid core (LC) and lumen. b Measurement of the lipid arc for a lipid-rich plaque. The maximum lipid arc was measured within a lipid-rich plaque (yellow lines). c A cholesterol crystal was defined as a thin, linear region of high signal intensity within the lipid plaque, without backscattering. d Measurement of fibrous cap thickness. The thickness was measured at the thinnest point three times, and the average was taken (white arrows). e Macrophage accumulation was defined as increased signal intensity within the fibrous cap, accompanied by heterogeneous backward shadows (arrowheads). f Microchannels were defined as small vesicular or tubular structures with diameters of 50–300 μm within the intima

