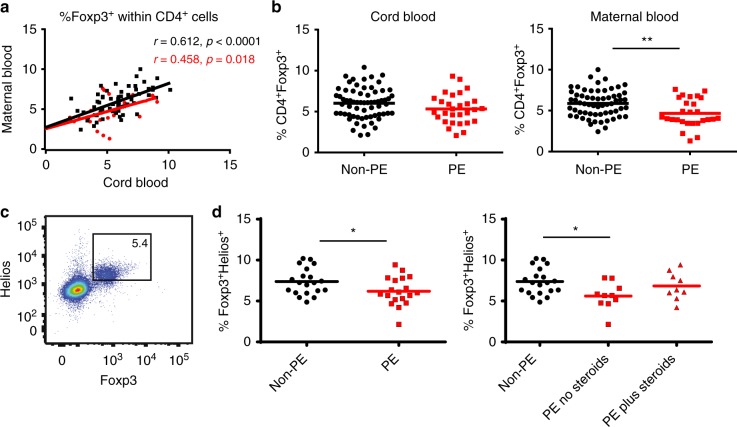
Fig. 2.
Reduced number of fetal Treg cells and fetal Treg thymic output in preeclampsia. Nepean cohort 3: a Scatter dot plot showing Treg cell frequencies in term maternal-fetal dyads in both non-preeclamptic (non-PE) (n = 62, black dots) and preeclamptic (PE) pregnancies (n = 26, red dots). Pearson’s correlation was used. Coefficient r and p-values as indicated. b Scattered dot plots comparing the %Foxp3+ (Mean) within CD4+ cells in cord blood (n = 66 for non-PE, n = 29 for PE group) and maternal blood (n = 62 for non-PE group, n = 27 for PE group) (unpaired t-test). Gating strategy for Foxp3+ Tregs from PBMC is shown in Supplementary Fig. 2. c Representative dot plot showing cord blood Foxp3+Helios+ cells gated on CD4+ cells. d Scattered dot plots showing the percentage of Foxp3+Helios+ cells (Mean) in cord blood. Left panel comparing %Foxp3+Helios+ cells in non-PE (n = 20) and PE (n = 19) groups (unpaired t-test). Right panel dividing the PE group into two subgroups based on steroids treatment: n = 10 for no Steroids and n = 9 for plus Steroids (one-way ANOVA with Dunnett’s multiple comparisons test). *p < 0.05, **p < 0.01

