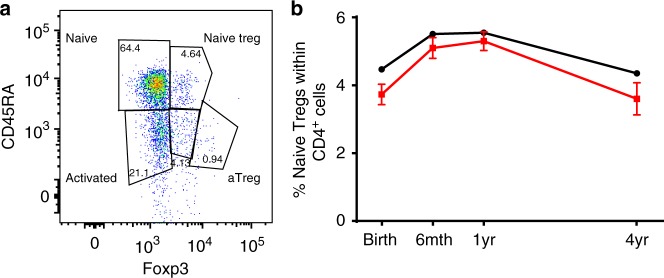
Fig. 3.
Naive Treg cell changes in infants exposed to preeclampsia. BIS study: a Representative dot plot showing the gating strategy for naive Tregs gated on CD4+ cells. b The line graphs showing the longitudinal naive Treg cell proportions (Mean ± SD, as a percentage of the CD4+ population) in children from preeclamptic mothers (Red: at birth n = 11; 6-month n = 19; 1-year-old n = 22; 4-year-old n = 10) and children from non-hypertensive mothers (Black: at birth n = 434; 6-month n = 558; 1-year-old n = 629; 4-year-old n = 377). The overall difference is –0.49% (95% CI –0.83, –0.16) (p = 0.004, generalized estimating equation)

