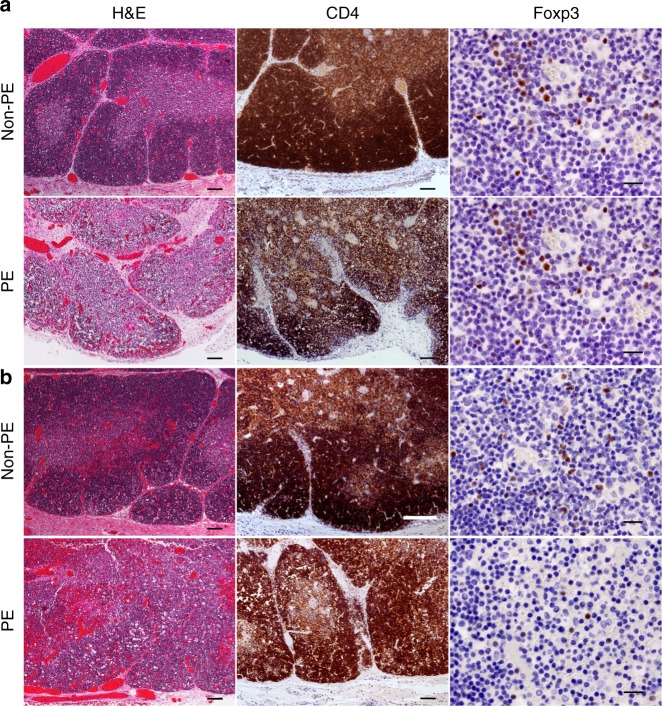
Fig. 4.
Fetal thymus histopathology. Photomicrographs of fetal thymuses stained to compare CD4+ and Foxp3+ T-cell populations between the control group and those mothers with preeclampsia at the time of fetal demise. a Fetal thymuses of Control (upper panel) and preeclamptic mothers (lower panel), at 24 weeks gestation. b A 33-week-old control fetus (upper panel), versus a 37-week-old fetus deceased to a mother who had preeclampsia (lower panel). Scale bars for H&E stains and CD4 stains = 100 µm. Scale bars for Foxp3 stains = 20 µm

