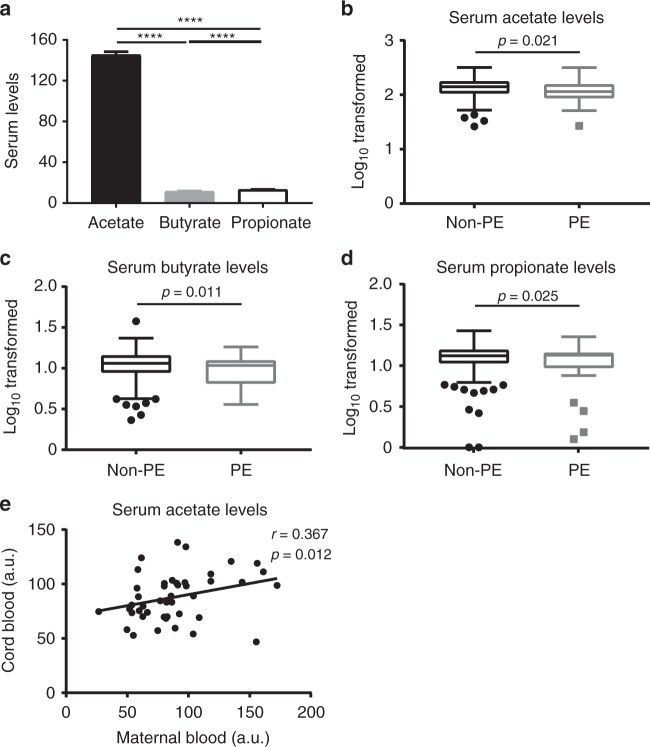
Fig. 5.
Serum acetate in healthy pregnancy and preeclampsia. BIS study: a Bar graph showing maternal serum levels (Mean ± SEM, µM) of acetate, butyrate, and propionate at 28 weeks of pregnancy (n = 324) (RM one-way ANOVA with Tukey’s multiple comparisons test, with the Greenhouse-Geisser correction). Box and whisker (Tukey) plots showing evidence of associations between lower (b) acetate, (c) butyrate, and (d) propionate levels (µM, Log base 10 transformed) from women with subsequent preeclampsia (PE, n = 31) and women without preeclampsia (non-PE, n = 293). p-values calculated using weighted logarithmic regression. Nepean cohort 4 (e): Scattered dot plot showing the relative serum acetate levels in paired term maternal peripheral blood and cord blood (n = 46) (samples were collected at full term delivery). The acetate levels were based on peak heights from the NMR spectra normalized to the total intensity. a.u. = arbitrary units (values are divided by 1000). Pearson r = 0.367, p = 0.012; Spearman rho = 0.416, p = 0.004

