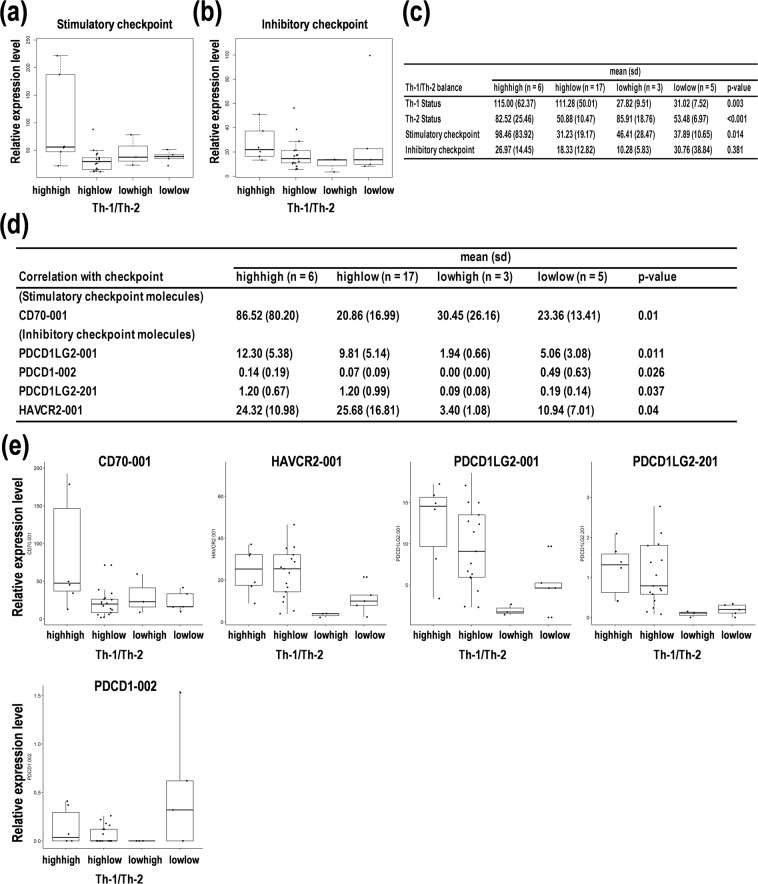
Figure 4.
Comparative expression analysis of immune checkpoint-related genes on the balance of T helper cell type 1/2 (Th-1/Th-2) status in primary central nervous system lymphoma (PCNSL). (a,b) Relative expression patterns of immune checkpoint-related genes based on the balance of Th-1/Th-2 status. (a) Stimulatory checkpoint. (b) Inhibitory checkpoint. (c) Statistics for the four subgroups defined as Th-1highTh-2high, Th-1highTh-2low, Th-1lowTh-2high, and Th-1lowTh-2low. The p-value indicates one-way analysis of variance (ANOVA). (d) Statistics for the differential expression of the genes on the four groups. The p-value indicates one-way ANOVA. (e) The box-whisker plots of the expression of stimulatory and inhibitory immune checkpoint genes. The PCNSL patients were divided into four subgroups including Th-1highTh-2high, Th-1highTh-2low, Th-1lowTh-2high, and Th-1lowTh-2low.

