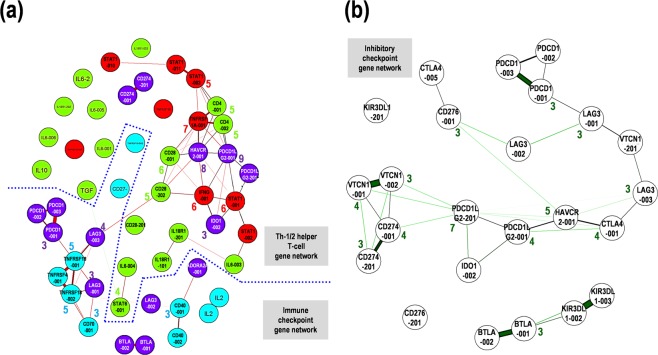
Figure 6.
Schematic representation of the correlation between the gene expression in the T helper cell type 1/2 (Th-1/Th-2) status and immune checkpoint in primary central nervous system lymphoma (PCNSL). (a) Correlation among Th-1 (red) and Th-2 (green), stimulatory checkpoint (blue), and inhibitory checkpoint (purple). (b) Correlation among inhibitory checkpoint molecules. Thick and thin lines with a distance indicate strong and weak correlation between the expression levels of the two genes. The numbers with circles indicate the numbers of nodes over two.

