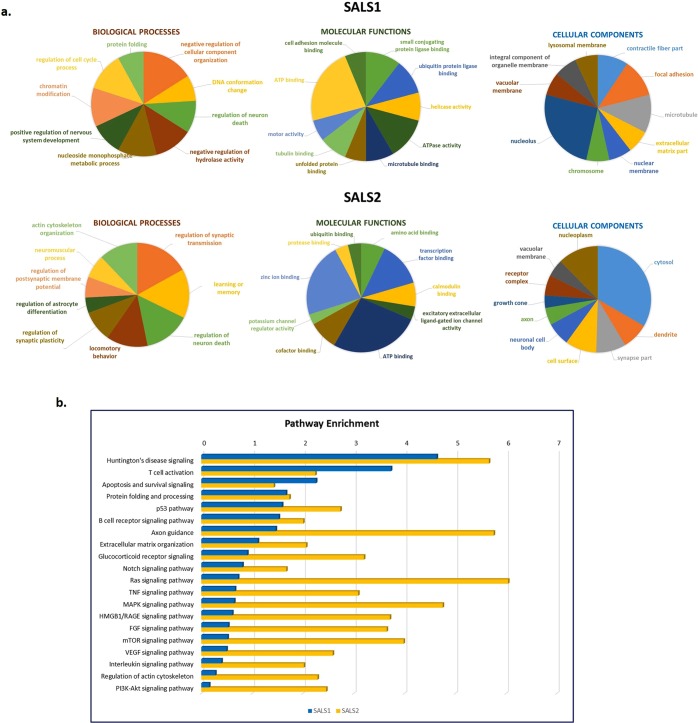
Figure 3.
Functional enrichment analysis for GO and pathway map ontologies revealed significant biological processes associated with the candidate CNV-driven genes in SALS. (a) Pie charts represent the top 10 enriched (P < 0.05) GO terms for the 70 CNV-encompassed DEGs in SALS1 and SALS2 patients. The GO terms were subdivided into three GO categories: biological processes, molecular functions and cellular components. Enrichment analyses were performed using the Enrichment Analysis tool in Enrichr. For each category, GO terms or biological features represented in CNV-driven differently expressed genes are indicated. (b) Representation of the top 20 most significantly enriched (P value < 0.05) canonical pathway maps associated with the candidate CNV-driven genes in SALS1 and SALS2 patients. A histogram of statistical significance (−log P value) is shown: the list is arranged in descending order with the most significant pathways at the top. The analysis was performed using the MetaCore™ pathway analysis suite.

