Fig. 3.
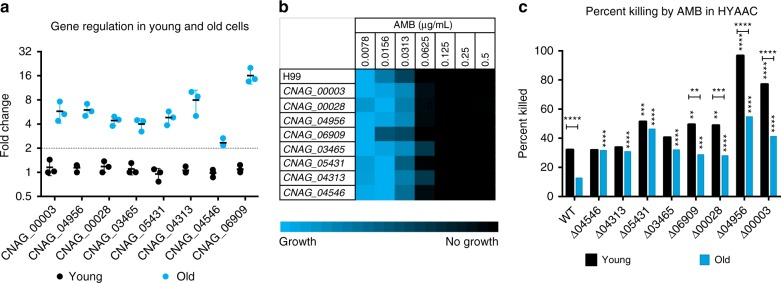
Age-associated gene characteristics. a Fold change of ten genes in young and old wild-type cells found by qRT-PCR analysis normalized to β-actin. Middle bar represent mean, error bars represent s.d. Fold change above 2 (dotted line) was considered significant. n = 3 biological replicates. (b) MIC analysis of wild-type and knockout strains. Brighter blue indicates more growth while black indicates no growth. n = 3 biological replicates. c Percent of old and young cells killed in the HYAAC device when subjected to 3 h of 0.125 μg mL−1 Amphotericin B for wild-type and all knockout strains. n = 200 cells per strain. Error bars represent s.d. Significance measured by Chi-square analysis. Horizontal *P < 0.05, **P < 0.01, ***P < 0.001, ****P < 0.0001 comparisons done between young and old of same strain. Vertical *P < 0.05, **P < 0.01, ***P < 0.001, ****P < 0.0001 comparisons done between wild-type and mutant

