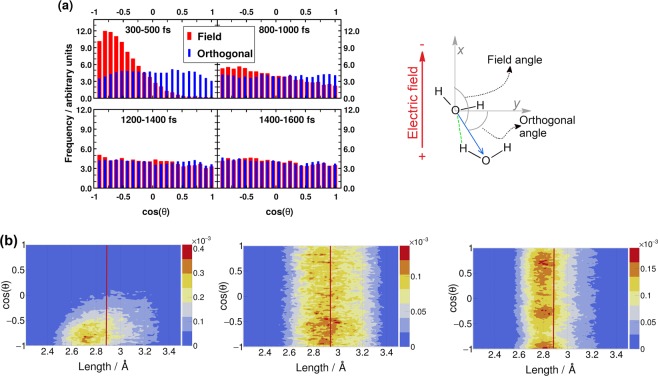
Figure 2.
(a) Distribution of the angle between the HB vector and the field-direction/orthogonal field-direction (red bars/blue bars). The definitions of the HB vector and the angles are depicted in the illustration on the right. (b) Normalized histogram of HB lengths resolved by the angle between the electric field and the HB vector (the red bars in (a)). The vertical red lines indicate the average HB length in each case. Left: 300–500 fs (average = 2.88 Å), middle: 1500–2000 fs (average = 2.94 Å), right: equilibrium microcanonical distribution for comparison (average = 2.88 Å).

