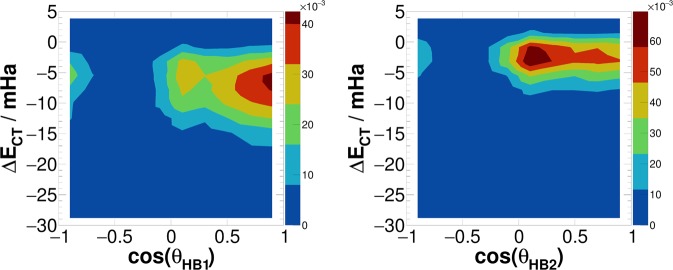
Figure 5.
Joint distribution of the angle between a HB (HB donor to acceptor vector) and the electric field, and the corresponding ALMO-EDA charge transfer energy. In this figure only the molecules that are simultaneously accepting two HBs or simultaneously donating two HBs are considered. The left and right subfigures correspond to the strongest and second-strongest HBs, respectively. Both subfigures were calculated at t = 500 fs, i.e. immediately after the pulse.

