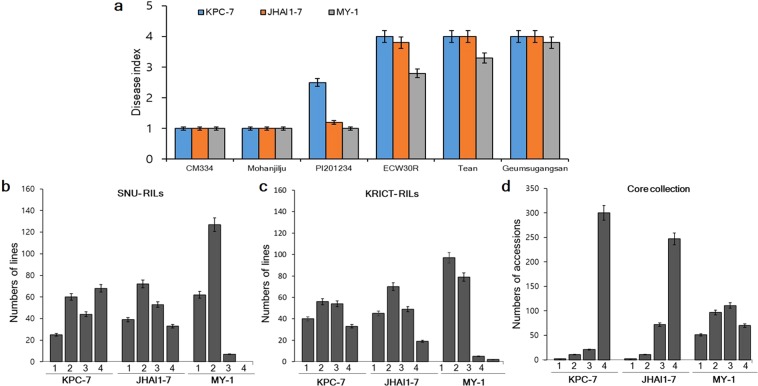
Figure 1.
Frequency distribution of PcRR in the parental lines, controls, ECRILs (SNU-RILs/KRICT-RILs), and GWAS (core collection). (a) Disease index of resistant controls (cv. CM334, Mohanjilju, and PI201234) and susceptible parents (cv. ECW30R, Tean, and Geumsugangsan) at three weeks post inoculation. (b) Frequency distribution of ECRILs against isolates KPC-7, JHAI1-7, and MY-1 in environment E1 (SNU-RILs). (c) Frequency distribution of ECRIL against isolates KPC-7, JHAI1-7, and MY-1 in environment E2 (KRICT-RILs). (d) Frequency distribution of GWAS (core collection) against isolates KPC-7, JHAI1-7, and MY-1. Bars denote the standard deviation.

