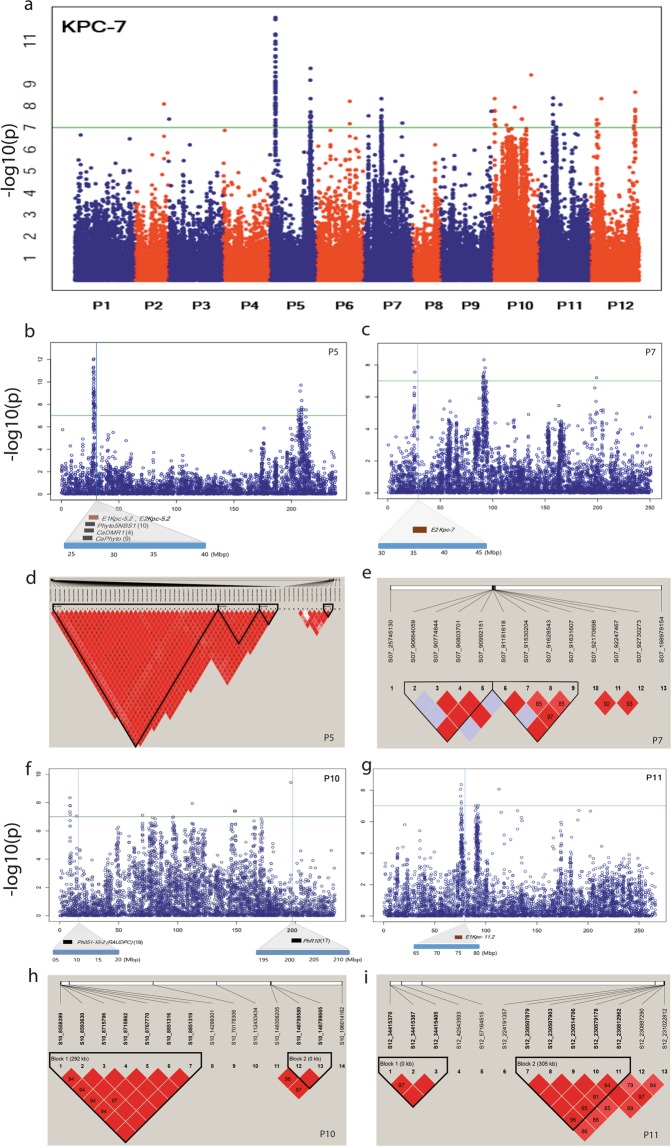
Figure 4.
Manhattan plots based on GBS-GWAS showing the significant SNPs associated with PcRR resistance and haplotype analysis. (a) Significant SNPs associated with PcRR isolate KPC-7. (b,c,f,g) SNPs detected in common regions of GWAS and ECRIL QTL maps from this and previous studies. QTL positions are marked with blocks under the SNP positions. Brown and black blocks indicate QTLs detected in this and previous studies, respectively. (d,e,h,i) Haplotype blocks containing significant SNPs on chromosomes P5, P7, P10, and P11.

