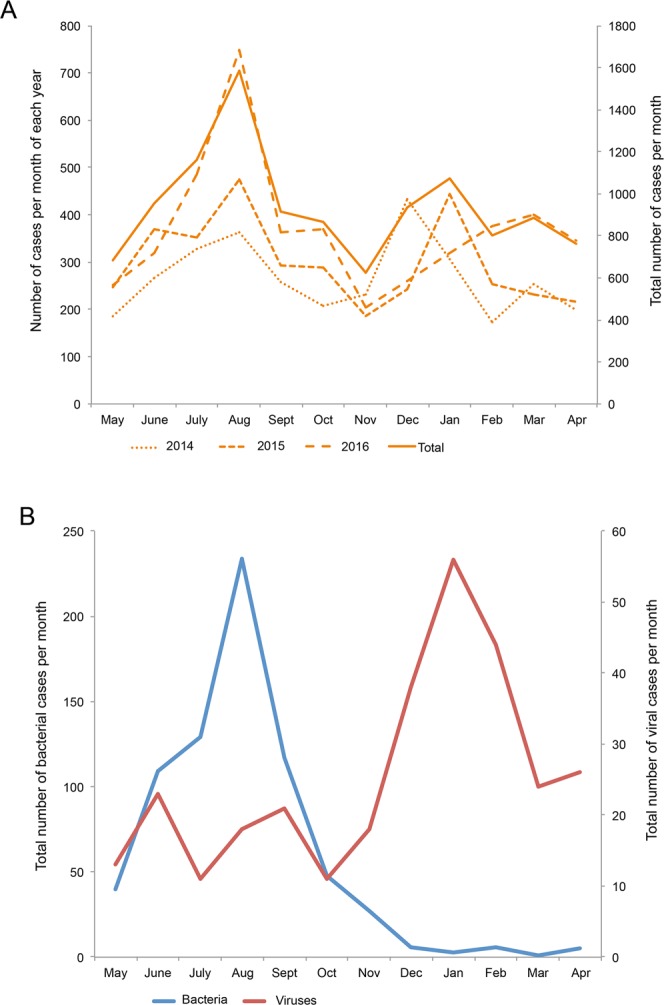
Figure 1.

Seasonal distribution of infectious diarrhea. (A) Three years of annual incidence data of acute infectious gastroenteritis from two sentinel hospitals were aligned by month. To better present the two peaks of the disease epidemics, the time axis was arranged from May to December and from the following January to April. (B) Subjects with identified pathogens were also aligned by month. To better present the two peaks of the viral and bacterial gastroenteritis epidemics, the time axis was arranged from May to December and from the following January to April.
