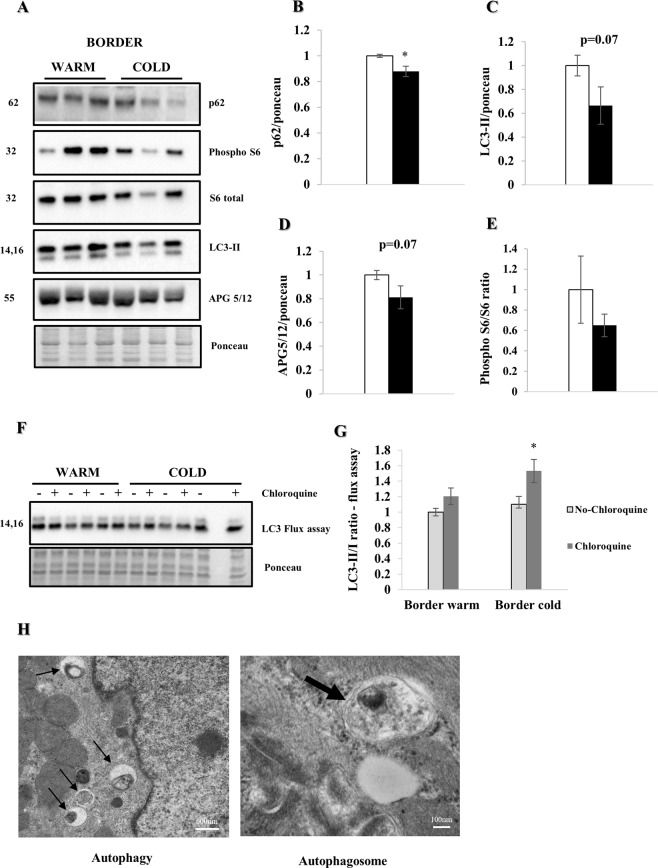
Figure 4.
Myocardial hypothermia increases autophagic flux. Female farm pigs (n = 3 per group) were euthanized one week post MI for biochemistry analysis on whole lysate of the LV border zone. All proteins were normalized to ponceau. (A) WB analysis with protein quantification (B–E) of p62, LC3-II APG5/12 and phospho-S6/S6 (Ser 235/236) ratio respectively. (F) WB analysis and quantification (G) of LC3-II/I ratio of the ex vivo autophagy flux assay (light gray bars with black border represent tissue without chloroquine, dark grey bars tissue with chloroquine treatment respectively). The data represents the mean ± SEM with *p < 0.05, comparing cold (black) vs. warm (white). (H) Representative EM images (3 h post MI, x30000 and x120000 respectively; the black thin arrows in the left image, show multiple autophagosomes due to enhanced autophagy in the cold condition with zoom on a single autophagosome in the right image). Due to space limitation, the blots are cropped from various gels, please see the supplemental data for full-length gels/blots.

