Figure 6.
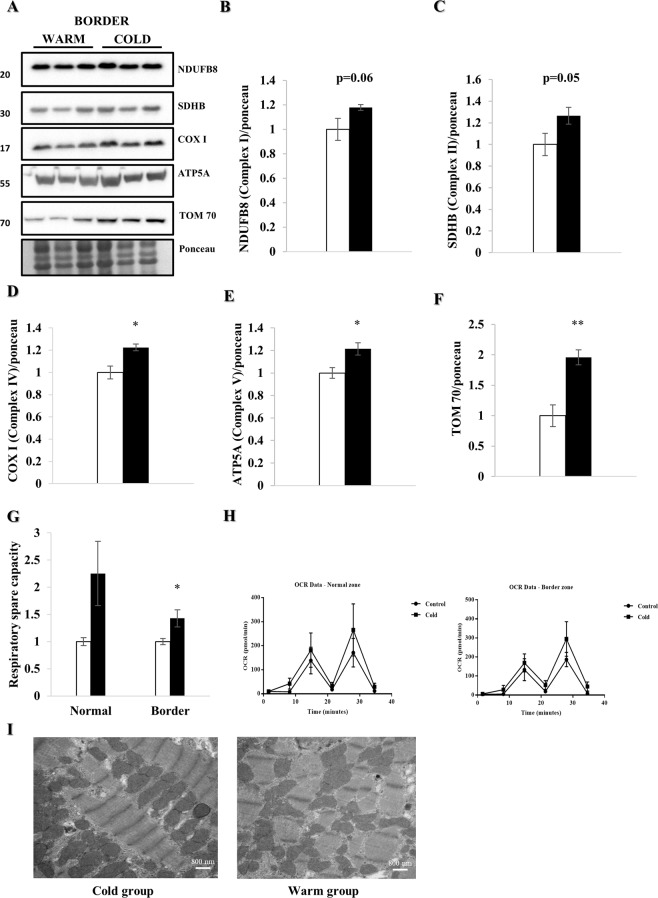
Mitochondrial mass and function are increased under hypothermia. LV border zone tissue from female farm pigs (n = 3 per group) was harvested one week post MI. WB analyses were performed on the whole lysate. All proteins were normalized to ponceau. (A) WB analysis with protein quantification (B–F) of NDUFB8, SDHB, COXI, ATP5A and TOM70 respectively. Mitochondrial respirometry analyses were performed on fresh isolated mitochondria of LV tissue (n = 7) 4 weeks post MI. (G) Respiratory spare capacity and respirometry trace (H) of the normal and border zone in the warm and cold group. (I) Representative EM images of mitochondria (x19000) demonstrating a disruption of density and structure of mitochondria in the warm condition after MI compared to the cold. The data represents the mean ± SEM with *p < 0.05, **p < 0.01, comparing cold (black) vs. warm (white). We normalized each protein to the entire corresponding lane on the ponceau-stained membrane, representing the total protein amount. Due to space limitation, the blots are cropped from various gels, please see the supplemental data for full-length gels/blots.

