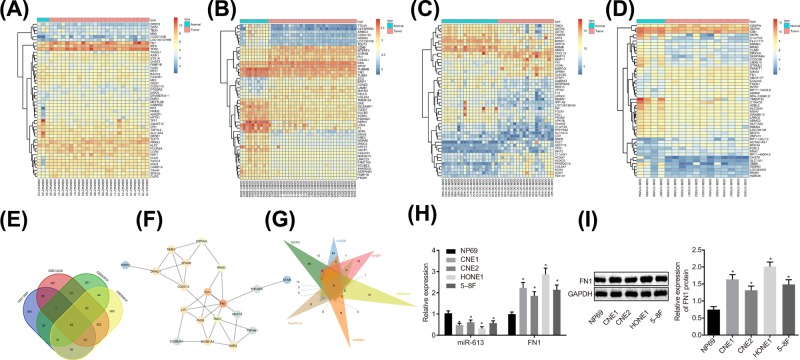
Figure 1. miR-613 participates in the development of NPC via the AKT signaling pathway by meditating FN1.
(A–D) The heat maps of top 50 DEGs in NPC microarray data, in which the abscissa represented the sample number, the ordinate represented the gene name, and the left dendrogram showed clustering of the gene expression. Each small square referred to the expression of a gene in a sample; (E) Venn analysis of DEGs in NPC microarray data. Four ellipses in the diagram represented the DEGs of four different NPC microarray data, and the middle part represented the intersection of the results of four microarray data; (F) the gene interaction network for 22 genes in intersection of four microarray data; (G) prediction of miRs regulating FN1. Six triangles in the figure represented the predicted results in the six databases, and the middle part referred to the intersection of the predicted results; (H) relative expression of miR-613 and FN1 in NP69, CNE1, CNE2, HONE1, and 5-8F cell lines; *P < 0.05 compared with NP69 cell line. (I) The protein level of FNI examined by Western blot analysis. The measurement data were expressed as the mean ± standard deviation; data between two groups were compared by the paired t-test; data among multiple groups were compared by one-way ANOVA; the experiment was repeated three times.

