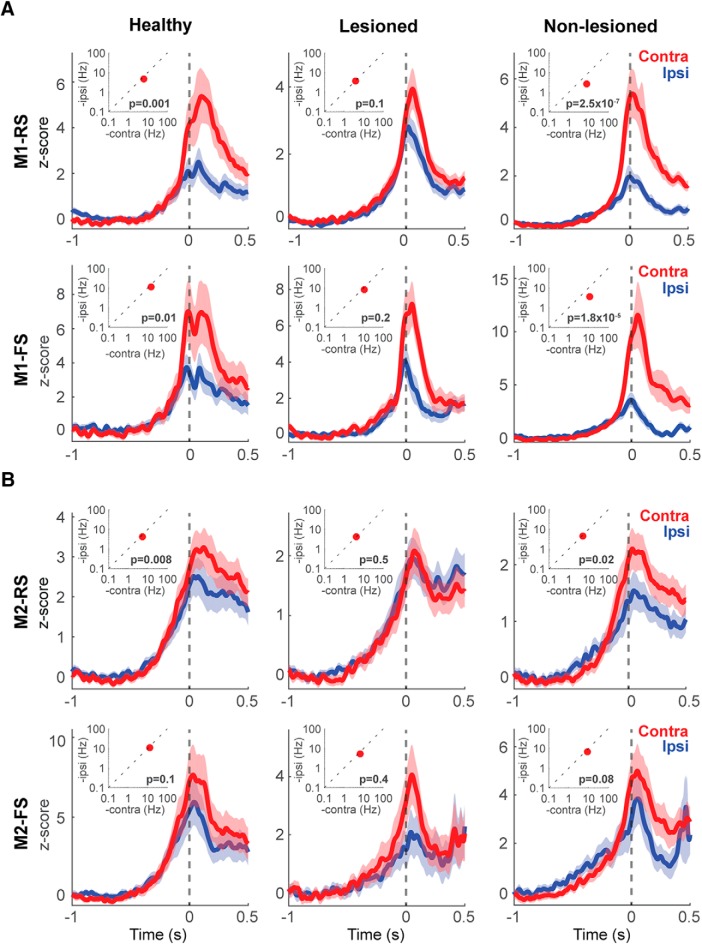
Figure 4.
Forelimb selectivity of neuronal activity. Go-type neurons activity during contralateral and ipsilateral movements in RS and FS neurons in M1 (A) and M2 (B). The plots show the averaged PETHs of all Go-type activity during contralateral (red) and ipsilateral (blue) choice trials. Solid lines represent means, shaded areas represent ±SD. H, healthy; L, lesioned; NL, non-lesioned. The insets show the difference between the average peak values during contralateral and ipsilateral movements. Wilcoxon rank-sum test.

