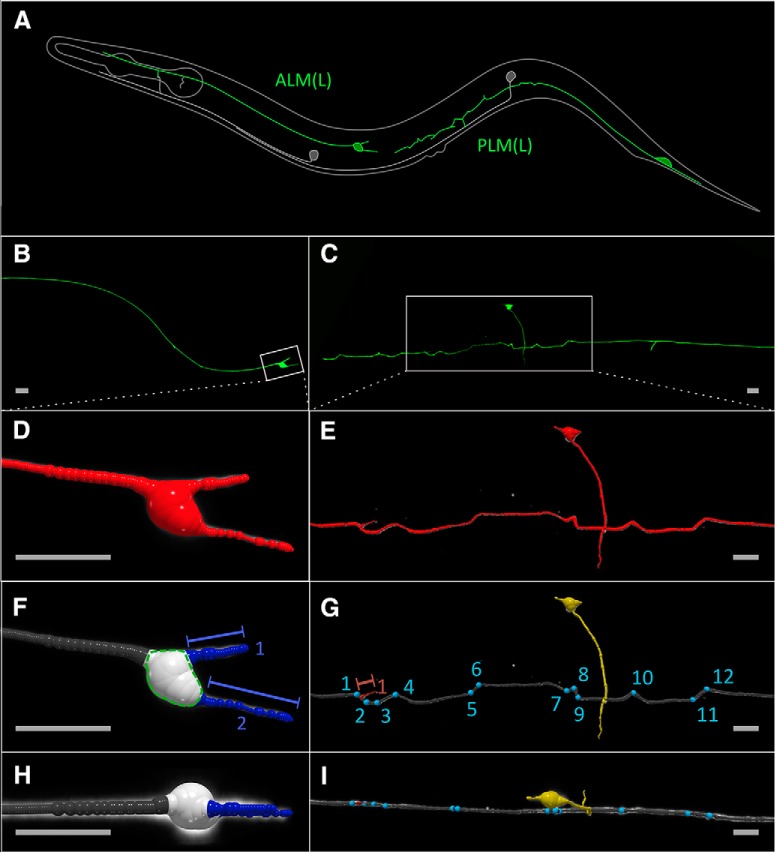
Figure 1.
Visual representation of the neuronal tracing algorithm and the confocal image of the C. elegans touch receptor neurons. A, Overview of C. elegans ALM and PLM touch receptor neurons. Only the left ALM(L) and PLM(L) neurons are shown in green. For detailed workflow for image acquisition and processing of ALM and PLM neuronal morphology see Extended Data Figure 1-1. B, Z-projection of a typical ALM neuron at day 8 of adulthood. C, Z-projection of a typical PLM neuron at day 8 of adulthood. D, E, Output of the APP2 neuron-tracing algorithm of region of interest shown in B, C, respectively (white rectangles), consists of a tree structure of connected nodes shown in red. F, H, Classified ALM neuronal tree with main-branch (gray), soma-nodes (white) and soma outgrowth (blue) in frontal (F) and top (H) view. Quantified morphologic features (soma-volume, soma outgrowth count and soma outgrowth length) are indicated in (F) and corresponding ground truth is shown in Extended Data Figure 1-2. G–I, Classified PLM tree with main-branch (gray), neurite-outgrowth (red) crossing PVM neuron (yellow) and sharp bends (blue) in lateral (G) and dorsal (I) view. Quantified morphologic features (bend count, neurite-outgrowth count and neurite-outgrowth length) are indicated in G and corresponding ground truth and quantification of sharp bends are shown in Extended Data Figures 1-2, 1-3. The heterogeneity of these age-related morphologic changes is illustrated by a collage of randomly selected z-projection of these neurons depicted in Extended Data Figure 1-4. Scale bars = 10 μm.Figure Contributions: Max Hess made all the figures.

