Figure 3.
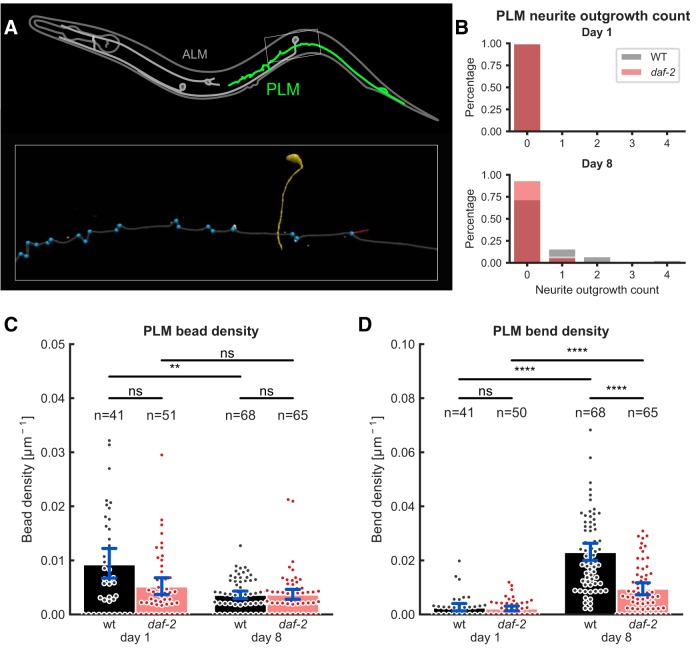
Age-related morphologic abnormalities of PLM neurons are less severe in long-lived daf-2 mutants. A, Overview of morphologic features quantified in PLM neurons. Inset shows enlarged rectangular region with quantifications indicated (neurite-outgrowth count and length, red; sharp bends, blue; beads not shown). Yellow structure is the crossing PVM neuron. B, Neurite outgrowth counts at days 1 and 8 of adulthood for WT and daf-2(e1370) mutants. WT animals showed a significant increase in the number of neurite outgrowths between day 1 and day 8 (p = 3.15e-04), and higher neurite outgrowth counts than daf-2(e1370) mutants at day 8 (p = 1.12e-03). For direct comparison of this data with previous studies, we replotted this data in percentage of PLM neurons with neurite outgrowths (Extended Data Fig. 3-1). C, A significant decrease in bead density (bead count divided by the total length of the neurite) is found for WT animals (p = 8.25e-03), but not for daf-2(e1370) mutants comparing day 1 to day 8, respectively. However, no significant difference between genotypes at day 1 or at day 8 was found. Error bars are 95% bootstrapped confidence interval of the mean, n is the number of PLM neurons scored. D, Both WT and daf-2(e1370) mutants showed the same density of sharp bends (bend count divided by the total length of the neurite) at day 1 of adulthood (p = 0.903), whereas at day 8 of adulthood, there is a significant increase in bend density (day 1 vs 8: WT, p = 5.87e-18 vs daf-2, p = 8.34e-06). However, daf-2(e1370) mutants seems to protect against age-related wrinkly appearance of neuronal processes (daf-2 vs WT, p = 3.85e-07). This is in contrast to daf-2(RNAi) shown in Extended Data Figure 3-2. Error bars are 95% bootstrapped confidence interval of the mean, n is the number of PLM neurons scored. Data were collected in three independent trials and pooled for the analysis shown in this figure (B–D). See Extended Data Figure 3-3 for different angle threshold settings and Extended Data Figure 3-4 the histogram of angles and corresponding cumulative distributions. The waviness caused by osmotic shrinkage of C. elegans looks different to the age-related sharp bends (Extended Data Fig. 3-5). ns = p > 0.05, ** = p < 0.01, *** = p < 0.001, **** = p < 0.0001. Figure Contributions: Max Hess made all the figures.

