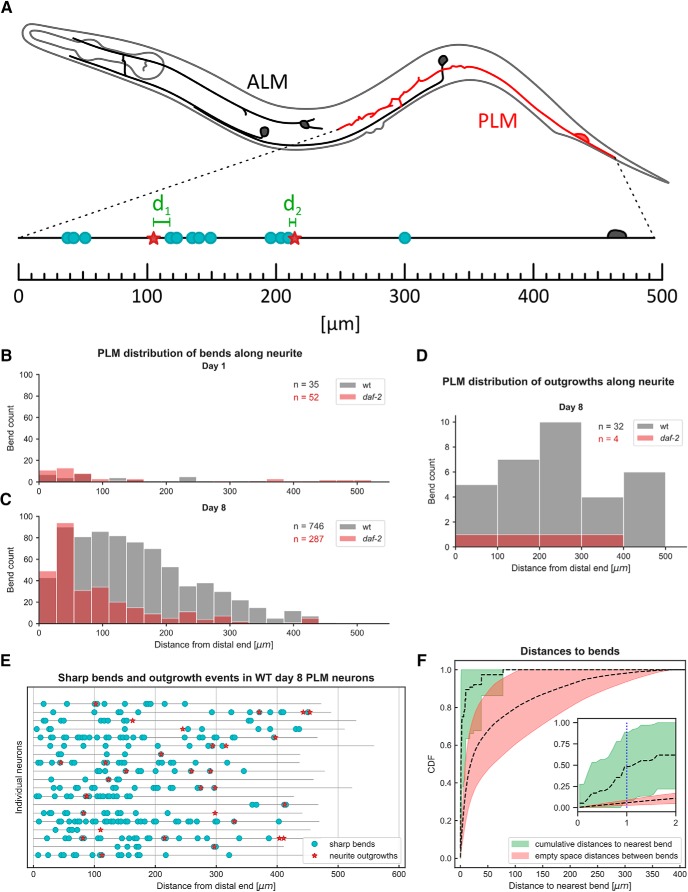
Figure 4.
Correlation of sharp bends with neurite outgrowths of PLM neurons during aging. A, Illustration depicting the procedure of determining the position of sharp bends (blue circles) and neurite outgrowths (red stars) along PLM neurons. The neuron was imagined to be stretch out along one dimension and the distances to the most distal point of the neuron was recorded. Furthermore, the distance to the nearest bend was recorded for every neurite outgrowth (green). B, C, Distribution of bends along the neurite for WT and daf-2(e1370) mutants at day 1 (B) and day 8 (C) shows distribution that bend occurrence is skewed toward the distal end of the neuron. C, At day 8 of adulthood, WT neurons (gray bars) not only showed a higher count of sharp bends compared to daf-2(e1370) mutants (red bars), but their distribution was shifted toward the proximal region of the neuron (Kolmogorov–Smirnov two-sample p = 3.20e-125). n indicates the number of sharp bend events evaluated. D, Distribution of outgrowth events along the neurite for WT and daf-2(e1370) mutants were not skewed toward the distal end. E, Plot of the 19 WT day-8 PLM neurons that showed neurite branching. Black lines represent the main branch stretched out along one dimension, neurite outgrowths (red stars) and sharp bends (blue circles) are plotted at their position along the neurite illustrates that outgrowth events often occur in close proximity to bends. F, CDFs of the distance to bends (confer A) and the ESD between bends. If outgrowths occurred independently of bends (meaning they were positioned randomly in the space between bends), one would expect the CDF to coincide with the empty space transformation. The course of the CDF compared to the ESD indicates that neurite outgrowths and sharp bends co-occur. As a statistical test, we assumed an interaction distance of 1 μm (inset, blue dotted line) and evaluated the individual CDFs and ESDs of the 19 WT day-8 neurons at that distance. A Wilcoxon signed-rank test showed that the percentage of outgrowth events that were 1 μm or closer to a sharp bend was significantly higher than one would expect if they were distributed randomly with respect to sharp bends (p = 2.90e-03). Data were collected in three independent trials and pooled for the analysis shown in this figure (B–F). Figure Contributions: Max Hess made all the figures.

