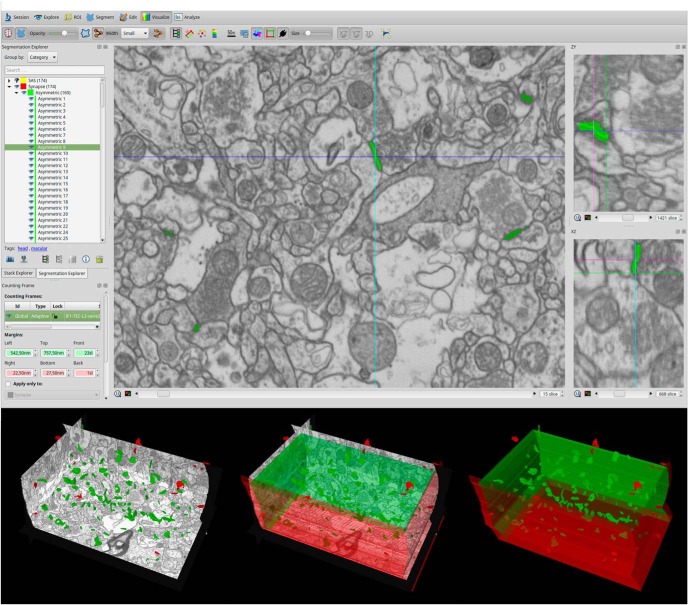
Figure 3.
Screenshot of the EspINA software user interface. In the main window (top), the sections are viewed through the xy-plane (as obtained by FIB/SEM microscopy). The other two orthogonal planes, yz and xz, are also shown in adjacent windows (on the right). The 3D windows (bottom left) show the three orthogonal planes and the 3D reconstruction of segmented synapses. A 3D rectangular unbiased CF is shown on the bottom. The three acceptance planes are represented in green and three exclusion planes in red. Synapses inside the CF are colored in green and synapses outside the CF in red.

