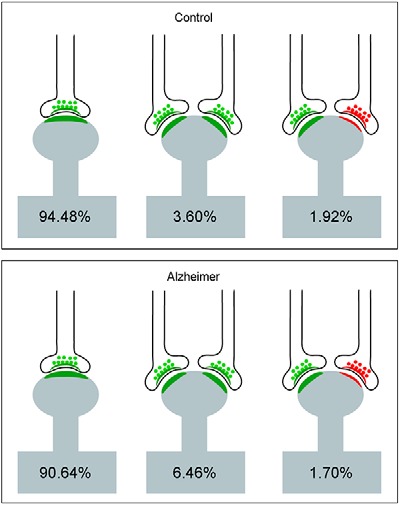
Figure 5.

Schematic representation of single and multiple synapses on dendritic spine heads. Percentages of each type are indicated. Synapses on the necks and other combinations that were rarely found (<1%) have not been represented. AS have been represented in green and SS in red. Control cases are represented on the top and AD patients on the bottom.
